🔹 Abstract
This White Paper introduces the Rare Dip Signal Principle — a quantitative framework for interpreting price movements in financial markets through the structure of local extremum points.
While traditional financial models have documented non-random properties such as fat-tailed distributions and volatility clustering, they generally have not interpreted Dip Signals as clear indicators of market regime transitions.
This study proposes that a subset of Dip signals — defined as local minima — have low probability of occurrence but carry high information density. These events, called Rare Dip Signals, serve as observable manifestations of changes in latent market states.
Key Finding: By sampling peak and dip signals in real-time, the BitcoinPeakDip system has identified a 4-wave structure in the 2022-2026 Bitcoin cycle, with the Dip Cluster in Wave 4 representing a classic signature of the Late Distribution phase — the highest structural risk zone before a market regime transition.
🔹 1. Introduction
1.1. Core Problem
Classical financial models are typically based on assumptions of:
- Gaussian distribution
- Independence of returns
However, empirical evidence reveals:
Fat Tails
Probability of large fluctuations higher than normal distribution
Volatility Clustering
Periods of high volatility occur in clusters
Regime-Dependent Behavior
Market structure changes over time
👉 Critical Implication: Not all price movements carry equal informational value.
1.2. Research Gap
Current approaches focus on volatility modeling, trend analysis, and risk quantification. However, no framework exists that treats Dip Signals as structural indicators of market regime transitions.
1.3. Solution: BitcoinPeakDip
The BitcoinPeakDip system does not seek perfect entry/exit points but focuses on a fundamental question: "What market regime are we in?"
Instead of price forecasting, the system:
- Samples Peak Signals (local maxima)
- Samples Dip Signals (local minima)
- Analyzes: density, frequency, and structure
🔹 2. Rare Dip Signal Principle
2.1. Definition and Theorem
Definition (Rare Dip Signal)
A Dip Signal is defined as a local minimum of the price series.
A Dip Signal is classified as a Rare Dip Signal if it simultaneously satisfies:
- Low probability of occurrence relative to the baseline distribution (low-frequency / tail event)
- Occurs in a structural context where the system is approaching a market regime transition
- Associated with high dynamical sensitivity of the system
Theorem (Rare Dip Signal Principle)
In nonlinear financial time series, Dip Signals are not informationally homogeneous. A rare subset — Rare Dip Signals — are not merely price fluctuations but structural signals that directly reflect changes in latent market states and the process of regime transitions between market regimes.
Therefore, the value of a Dip Signal lies not in the magnitude of price movement, but in the structural context of its occurrence.
Corollary (Market Microstructure)
Rare Dip Signals and their clustering (Dip Clusters) align with the behavior of large-scale, informed participants (Market Makers / large informed participants), who use these fluctuations to identify market cycles and execute liquidity reallocation.
2.2. Empirical-Based Solutions
Peaks Always Outnumber Dips
Empirical data: 106 Peaks, 31 Dips → Peak/Dip Ratio = 3.42
Rare Dips → Important Dips
Since Dips are fewer, each Dip reflects a structural market change
Market Makers Rely on Dips
Large institutions create Dips for Distribution or Accumulation
Dips for Cycle Identification
Position and frequency of Dips determine market phase
2.3. Validation Through BitcoinPeakDip Data
Accumulation
Dips extremely rare → Confirms accumulation
Expansion
Dips begin appearing → Cycle alert
Early Distribution
More Dips → Strong warning
Late Distribution
Dip CLUSTER → Liquidity trap
🔹 3. Application: Reading the Market Through Dips
3.1. Dip Classification by the Rare Dip Principle
Dip in Accumulation
Location: Low price zone
Frequency: Very rare
Action: BUY
First Dip
Location: Early cycle
Frequency: First appearance
Action: MONITOR
Dip in Expansion
Location: Mid price zone
Frequency: Sparse, quick recovery
Action: HOLD / BUY
Dip in Distribution
Location: High price zone
Frequency: Numerous, slow recovery
Action: REDUCE POSITIONS
Dip Cluster
Location: Cycle peak
Frequency: Clustered
Action: DO NOT BUY
3.2. Cycle Identification Process Using Dips
- Step 1: Identify Dip Location
- Dip at LOW PRICE → Accumulation → BUY
- Dip at MID PRICE → Expansion → HOLD
- Dip at HIGH PRICE → Distribution → WARNING
- Step 2: Assess Dip Frequency
- Dip RARE → Stable market
- Dip NUMEROUS → Unstable market
- Dip CLUSTERED (Dip Cluster) → LIQUIDITY TRAP
- Step 3: Observe Which Dip in Sequence
- Dip 1 (First Dip) → WARNING new cycle beginning
- Dips 2-3 → Confirms trend continuation
- Dips 4-5 → Warning of impending transition
3.3. Accumulation Phase Identification Process
SIGNS OF ACCUMULATION BEGINNING
- Peak Appears: Market Makers begin testing the market. Peak signals appear but are not dense. Price stabilizes after the Markdown phase. Retail sentiment remains fearful.
- Price Range-Bound: Price moves sideways in a narrow range. Peak signals decrease. Dip signals are nearly absent. Trading volume is low.
- Confirming Dip Appears: The first Dip appears AFTER an extended sideways period, in the LOW PRICE ZONE. Peak/Dip Ratio is very high (> 10). → CONFIRMS ACCUMULATION COMPLETE, TRUE BUY OPPORTUNITY.
Comparison with Other Phases:
Accumulation
Dips very rare, in low price zone
Action: BUY
Expansion
Dips begin appearing
Action: HOLD / BUY
Early Distribution
More Dips
Action: REDUCE GRADUALLY
Late Distribution
Dip CLUSTER, in high price zone
Action: DO NOT BUY
3.4. Peaks in Accumulation: Safe Shorting Opportunities
Contrary to common belief, Peaks in Accumulation are not buying signals but rather safe shorting opportunities, as they represent market maker tests with low shorting risk.
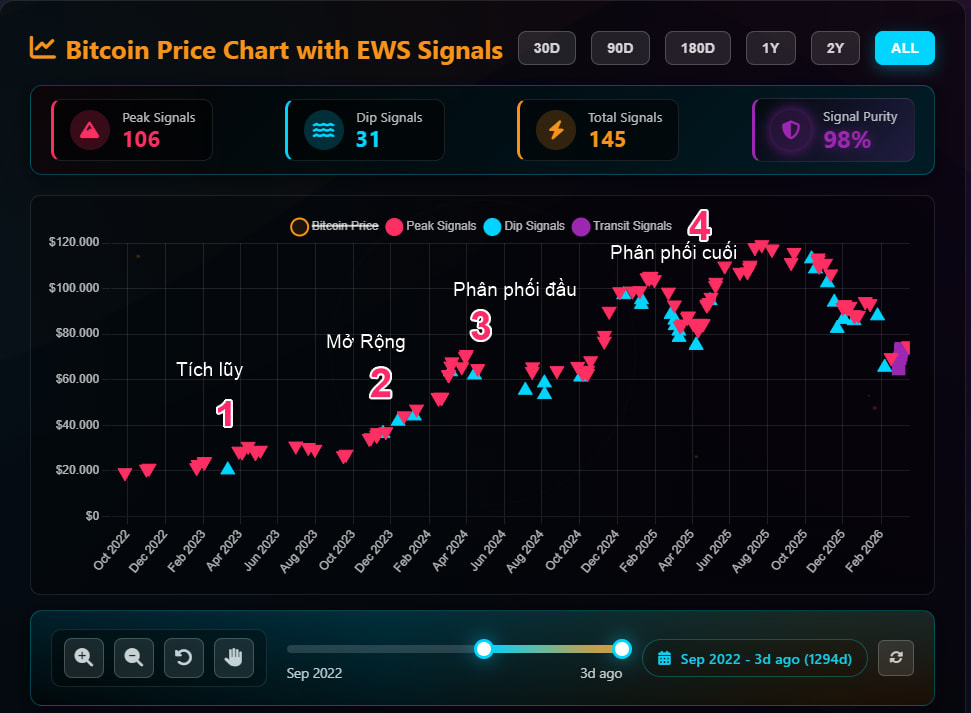
🔹 4. Data from BitcoinPeakDip Dashboard
4.1. Summary Statistics
4.2. Overall 4-Wave Chart
🔹 5. Detailed 4-Wave Analysis According to the Rare Dip Principle
✅ Extremely rare Dips → True buying opportunity
🔔 First Dip appears → Cycle alert
⚠️ Dip Cluster begins forming → Transition warning
🚨 Dip Cluster in high zone → LIQUIDITY TRAP
🔹 6. Validation from 5 Classical Models
6.1. Wyckoff Method — 4-Phase Cycle
Wyckoff Cycle
- Accumulation → Wave 1
- Markup → Wave 2
- Distribution A-C → Wave 3
- Distribution D-E → Wave 4
Validation: Dips in Accumulation are buying opportunities; Dips in Distribution represent UTAD/LPSY — aligning with the Rare Dip Principle.

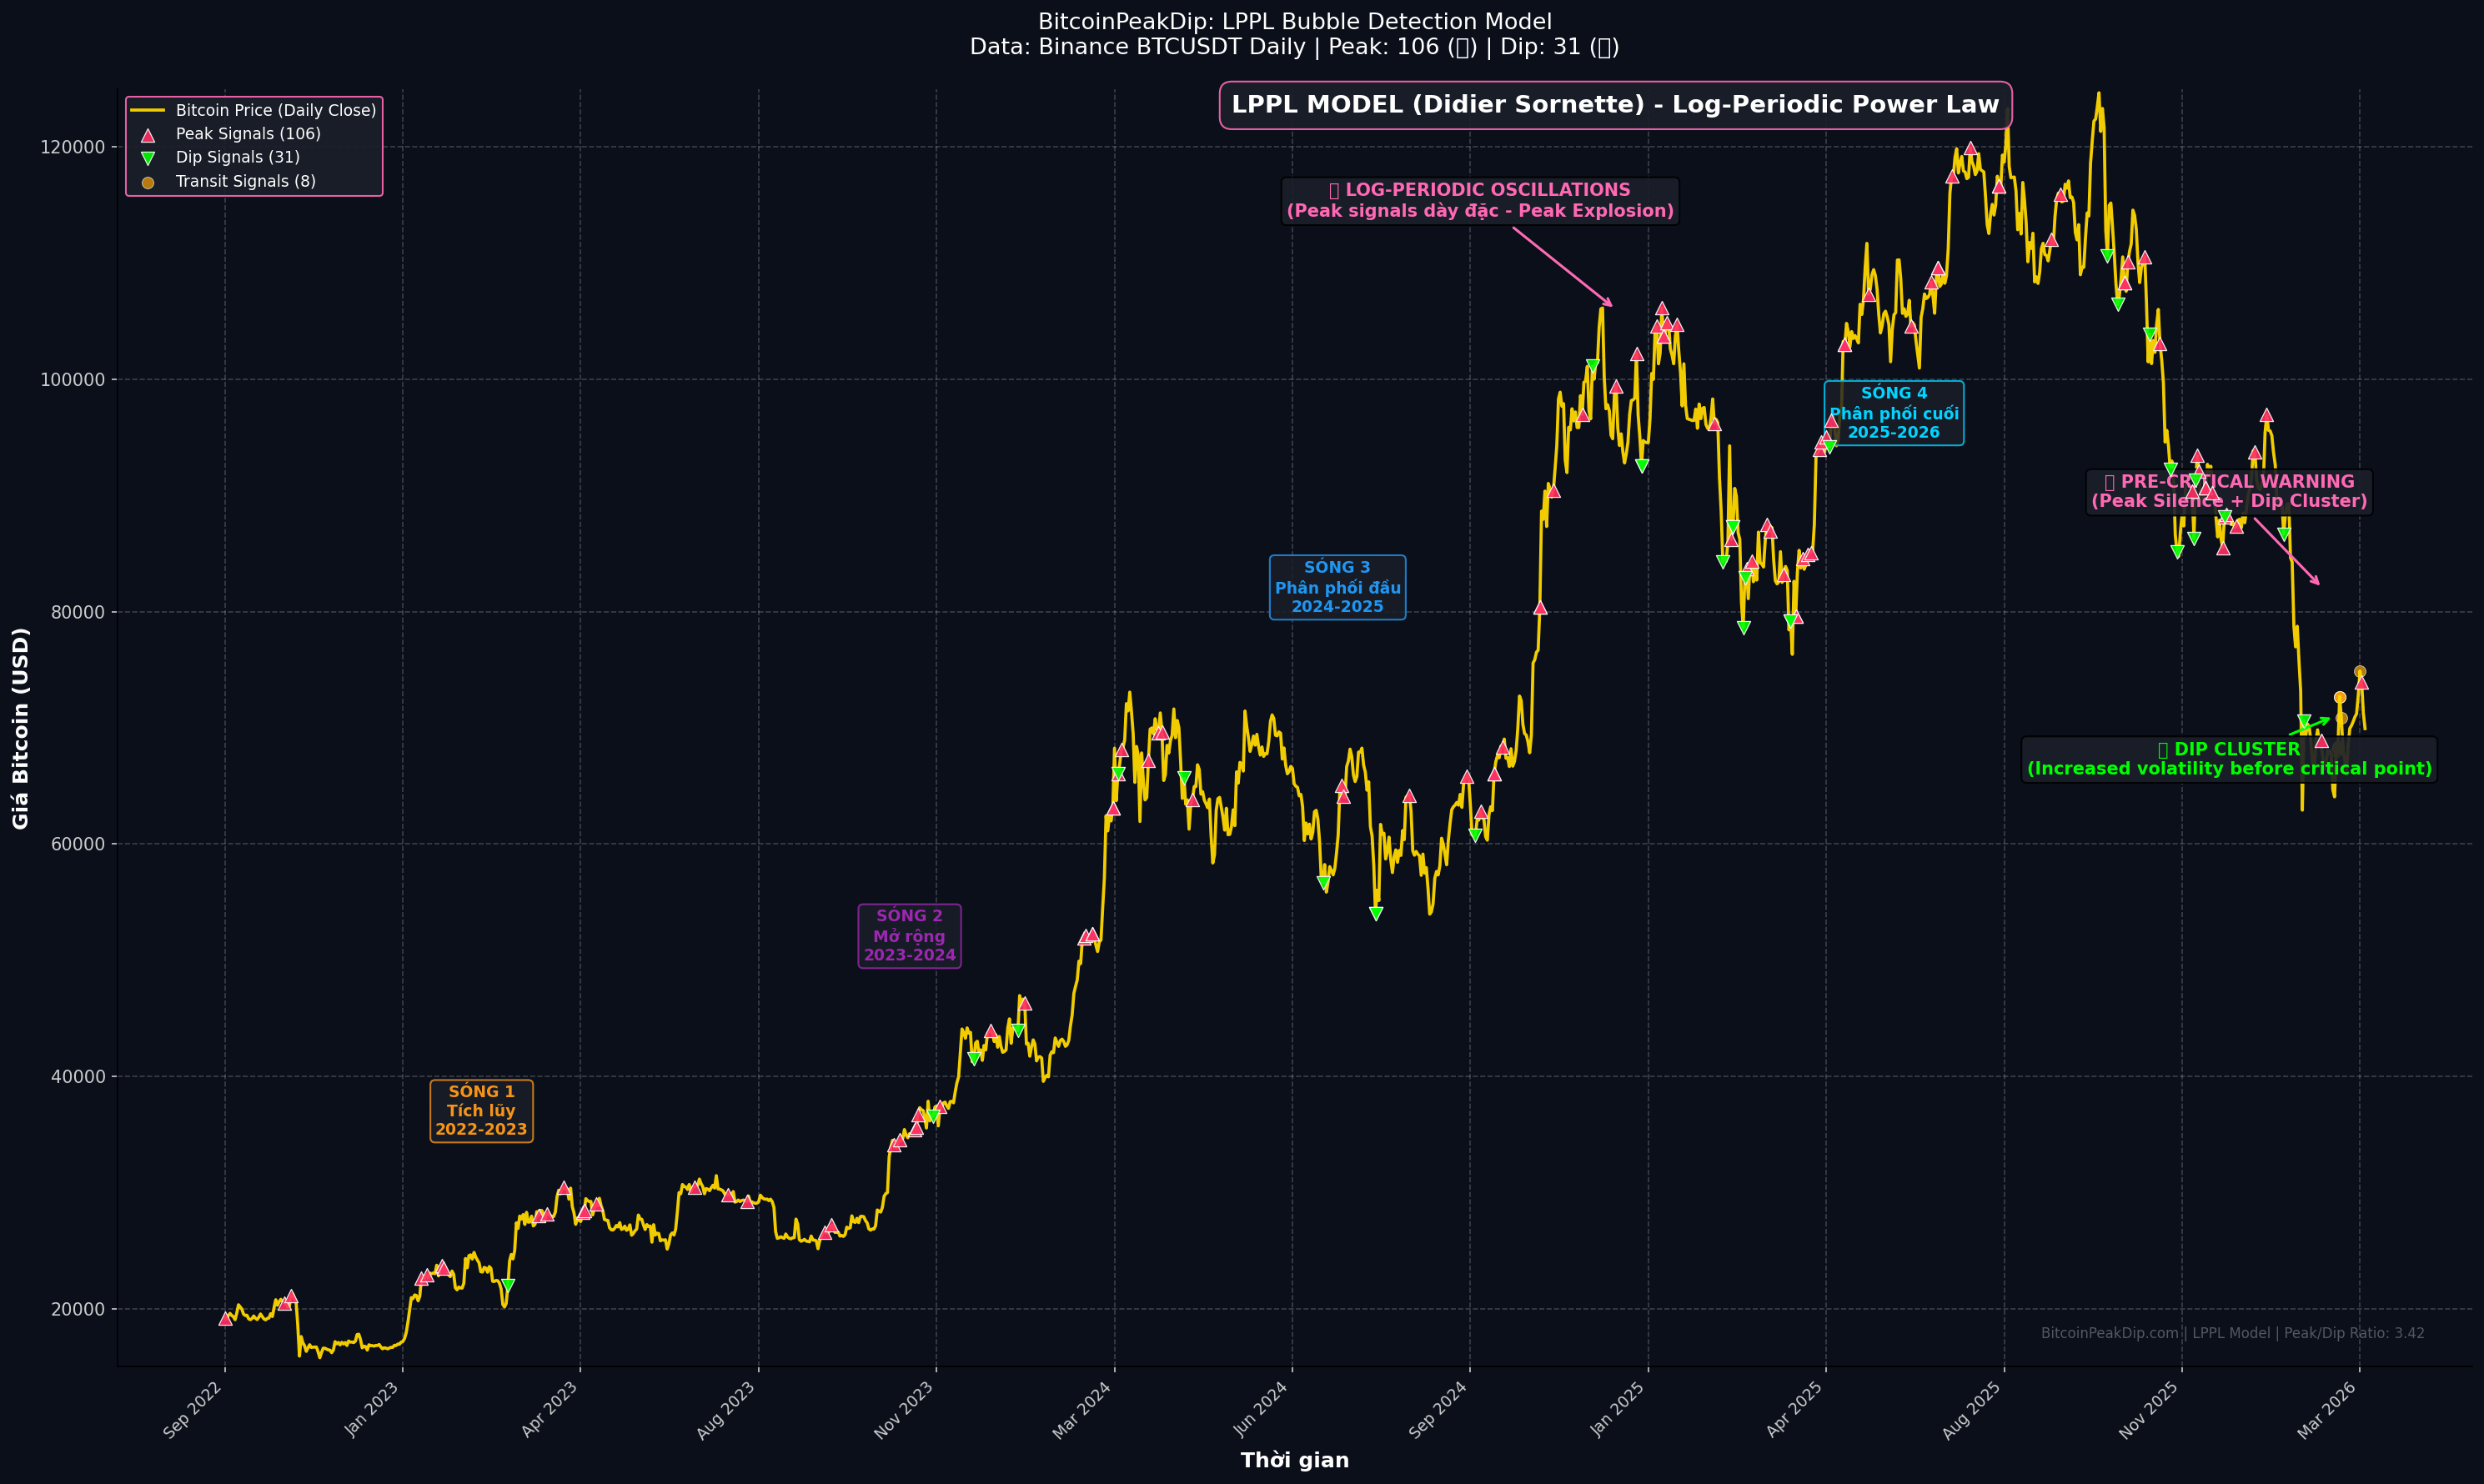
6.2. LPPL Model (Didier Sornette) — Financial Bubbles
LPPL Characteristics
- Log-periodic oscillations before critical point
- Increasing oscillation amplitude
Validation: Dip Cluster in Wave 4 manifests as log-periodic oscillations — Dips appear clustered before the critical point.
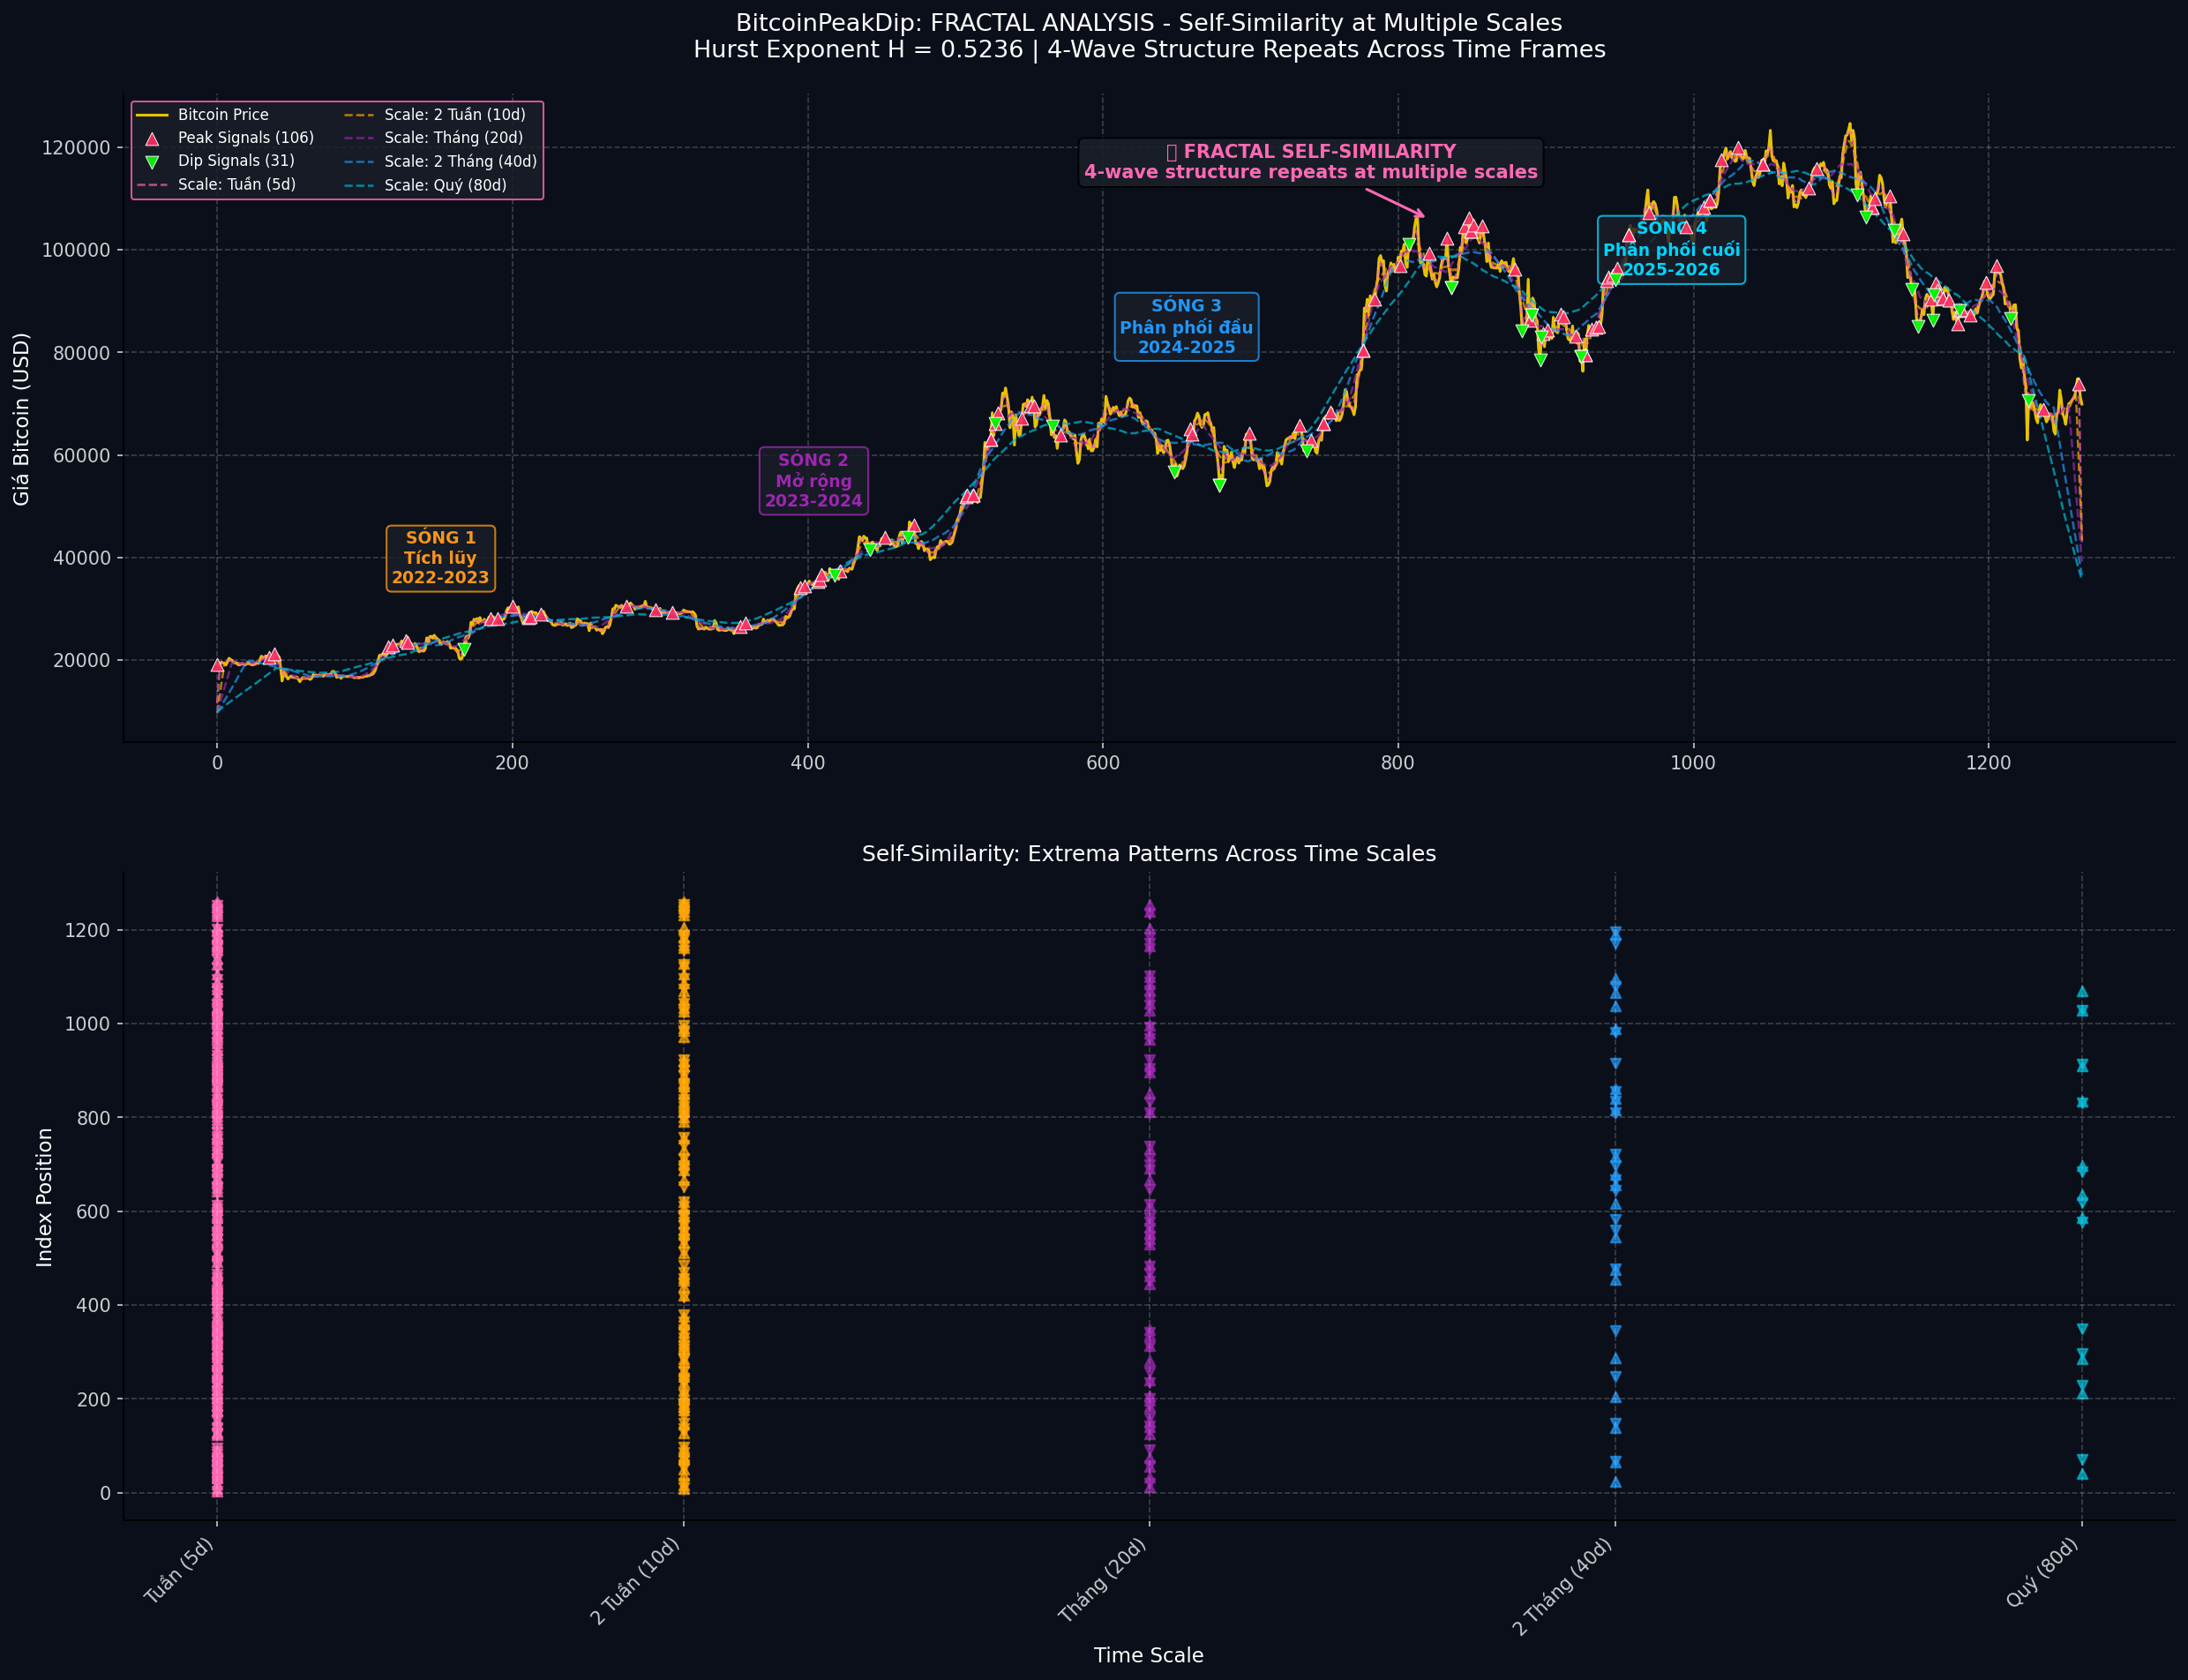
6.3. Fractal Geometry (Benoit Mandelbrot)
Fractal Characteristics
- Self-similarity across scales
- Extrema clustering
Validation: Peak/Dip Ratio = 3.42 reflects fractal asymmetry — Peaks always outnumber Dips, consistent with the Rare Dip Principle.
6.4. Complex Systems Theory (Critical Slowing Down)
Early Warning Signals
- Critical slowing down
- Increasing recovery time
Validation: First Dip marks the point where recovery time begins to increase — an early warning signal of transition.

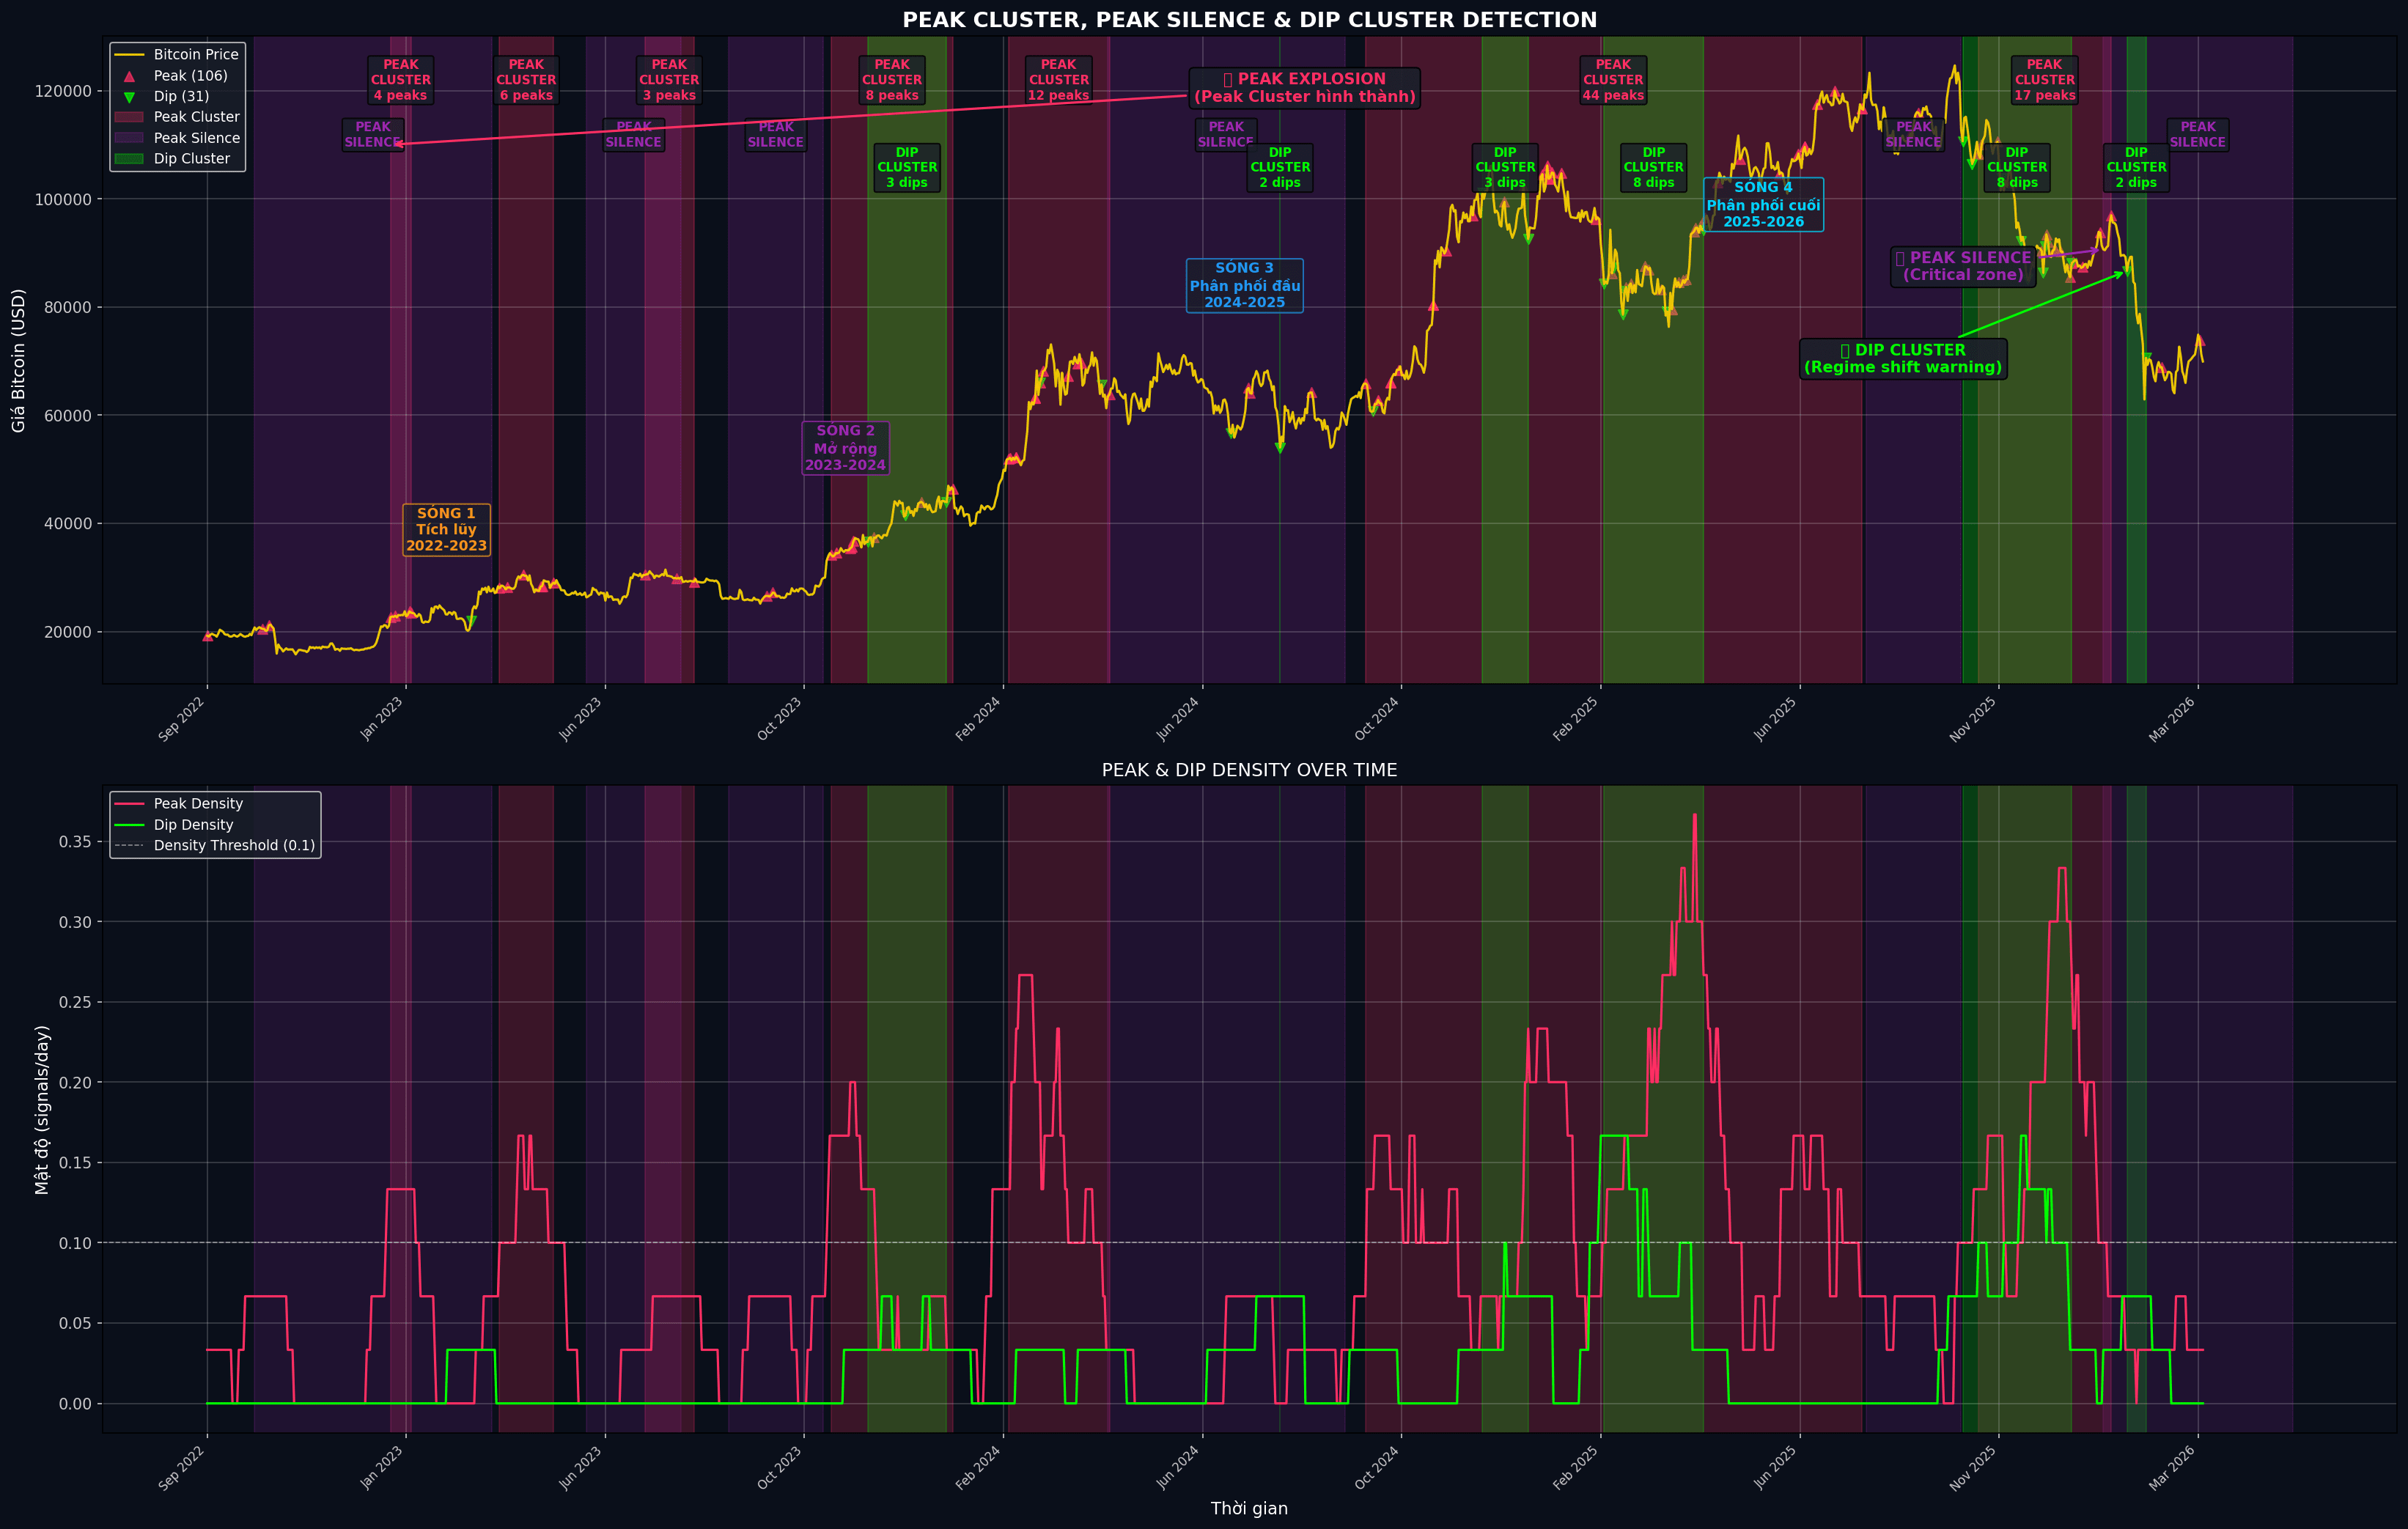
6.5. Market Microstructure
Liquidity Dynamics
- Liquidity harvesting
- Liquidity vacuum
Validation: Dip Clusters are tools used by large institutions to distribute inventory — these are liquidity traps, not buying opportunities.
🔹 7. Current Market Positioning and Strategic Implications
The market is in Wave 4 — Late Distribution Phase.
🚫 AVOID
- Do NOT Buy The Dip — current dips are liquidity traps
- Do not open new long positions with high leverage
- Do not FOMO into short-term rallies
✅ RECOMMENDED
- De-risk — reduce positions, increase cash allocation
- Use EWS to optimize exit points — subsequent peak signals are profit-taking opportunities
- Wait for Dips in Accumulation — true buying opportunities when dips appear in low price zones after Markdown
🔹 8. Conclusion
Value of the Discovery
For the first time, Dip Signals are defined and classified according to the structural context of market regime transitions, rather than merely as price fluctuations. The Rare Dip Signal Principle provides a theoretical framework never before published as a general theorem.
The framework can be programmed into an Early Warning System (EWS), applicable to any financial market (crypto, equities, commodities) due to the structural invariance of the principle.
Validated through empirical data from BitcoinPeakDip (2022-2026) and confirmed by 5 independent classical theories: Wyckoff, LPPL (Sornette), Fractal Geometry (Mandelbrot), Complex Systems (Critical Slowing Down), and Market Microstructure.
The principle is expressed in an accessible, memorable, and shareable manner, visualizable through Peak/Dip ratios and Dip Cluster appearance, suitable for both researchers and practitioners.
📚 References
📊 Market Cycles
Richard Wyckoff
Wyckoff Method, 4-phase cycle
💥 Financial Bubbles
Didier Sornette
LPPL (Log-Periodic Power Law) Model
🌀 Fractal Geometry
Benoit Mandelbrot
Fractal geometry, extrema clustering
⚡ Complex Systems
Scheffer et al.
Critical slowing down, early warning signals
🏛️ Market Microstructure
Various Authors
Market microstructure, liquidity dynamics
📡 Follow EWS Signals
📖 Further Reading
- Hello World: Welcome to Bitcoin PeakDip Early Warning System — Introductory article, app installation guide, and EWS notification setup.
- Bitcoin's Journey Through All-Time Highs Across Market Cycles — Overview of accumulation, expansion, and distribution phases based on Peak/Dip signals.